
Being a person with disabilities in the European Union can feel a bit like a postcode lottery. Your daily reality will likely depend on where you live. It is not just a question of whether you live in a big city or a rural area. The country you live in also plays a big role.
Eurostat is the statistics agency of the European Union. It coordinates with EU countries to collect and analyse information on the lived realities of persons with disabilities. This allows us to compare the situation in different EU countries.
Which countries are Europe’s worst performers?
We will focus on 3 crucial themes for persons with disabilities:
- Poverty and the inability to make ends meet
- Unmet health needs and health costs
- School completion among persons with disabilities.
Who are our sad champions in this hall of shame?
Poverty and social exclusion
28.8% of persons with disabilities aged 16 or over 16 years-old are at risk of poverty and social exclusion in the EU. However, a number of EU countries fare far worse. The EU countries in question and the percentage of persons with disabilities at risk of poverty and social exclusion are the following:
- Lithuania: 50.5% (21.9% for persons without disabilities)
- Latvia: 42.6% (18.1% for persons without disabilities)
- Bulgaria: 42.3% (26.6% for persons without disabilities)
- Croatia: 39.8% (15.6% for persons without disabilities)
- Romania: 37% (23.2% for persons without disabilities)
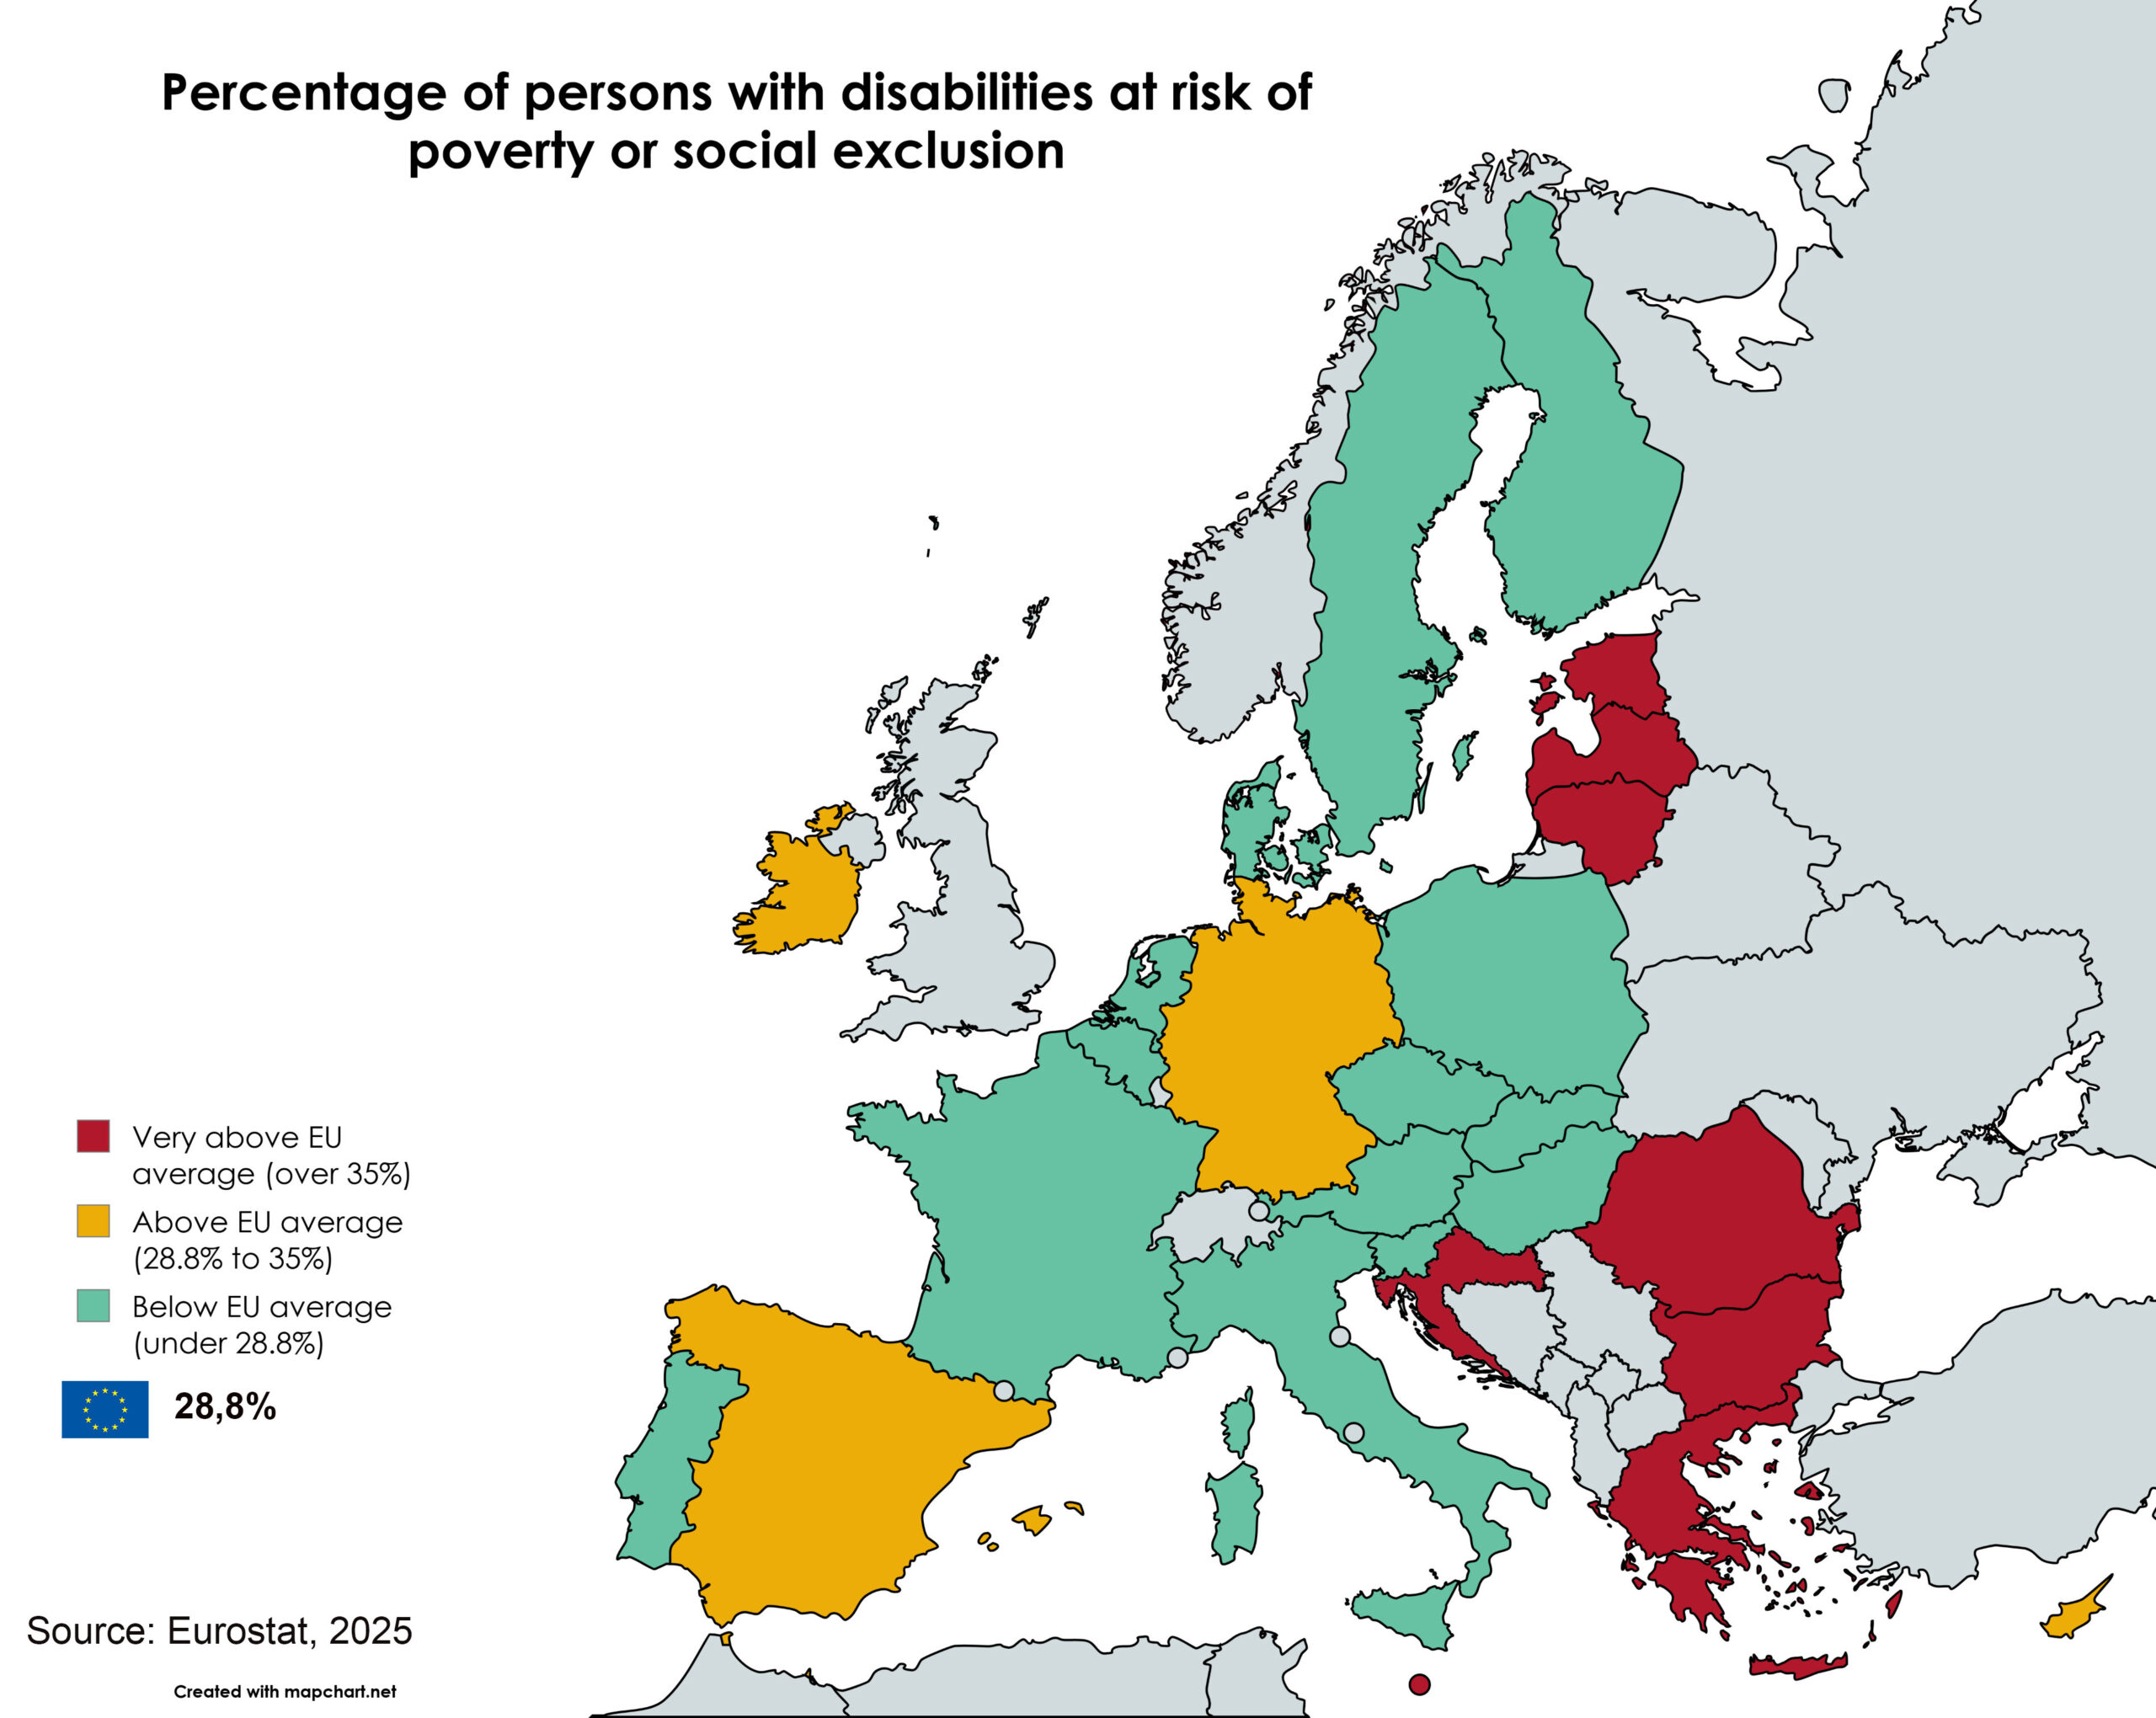
Discover the full statistics on poverty on the EUROSTAT website
Inability to make ends meet
This refers to how easily a person can pay necessary expenses with their income.
On average in the EU, 9.1% of people with disabilities have difficulty make ends meet. The Member States that perform the worst are:
- Greece: 46.3% (32.3% for people without disabilities)
- Bulgaria: 19.4% (9.7% for people without disabilities)
- Portugal: 13.9% (6.7% for people without disabilities)
- Romania: 13.8% (7.6% for people without disabilities)
- Spain: 12.4% (6.9% for people without disabilities)
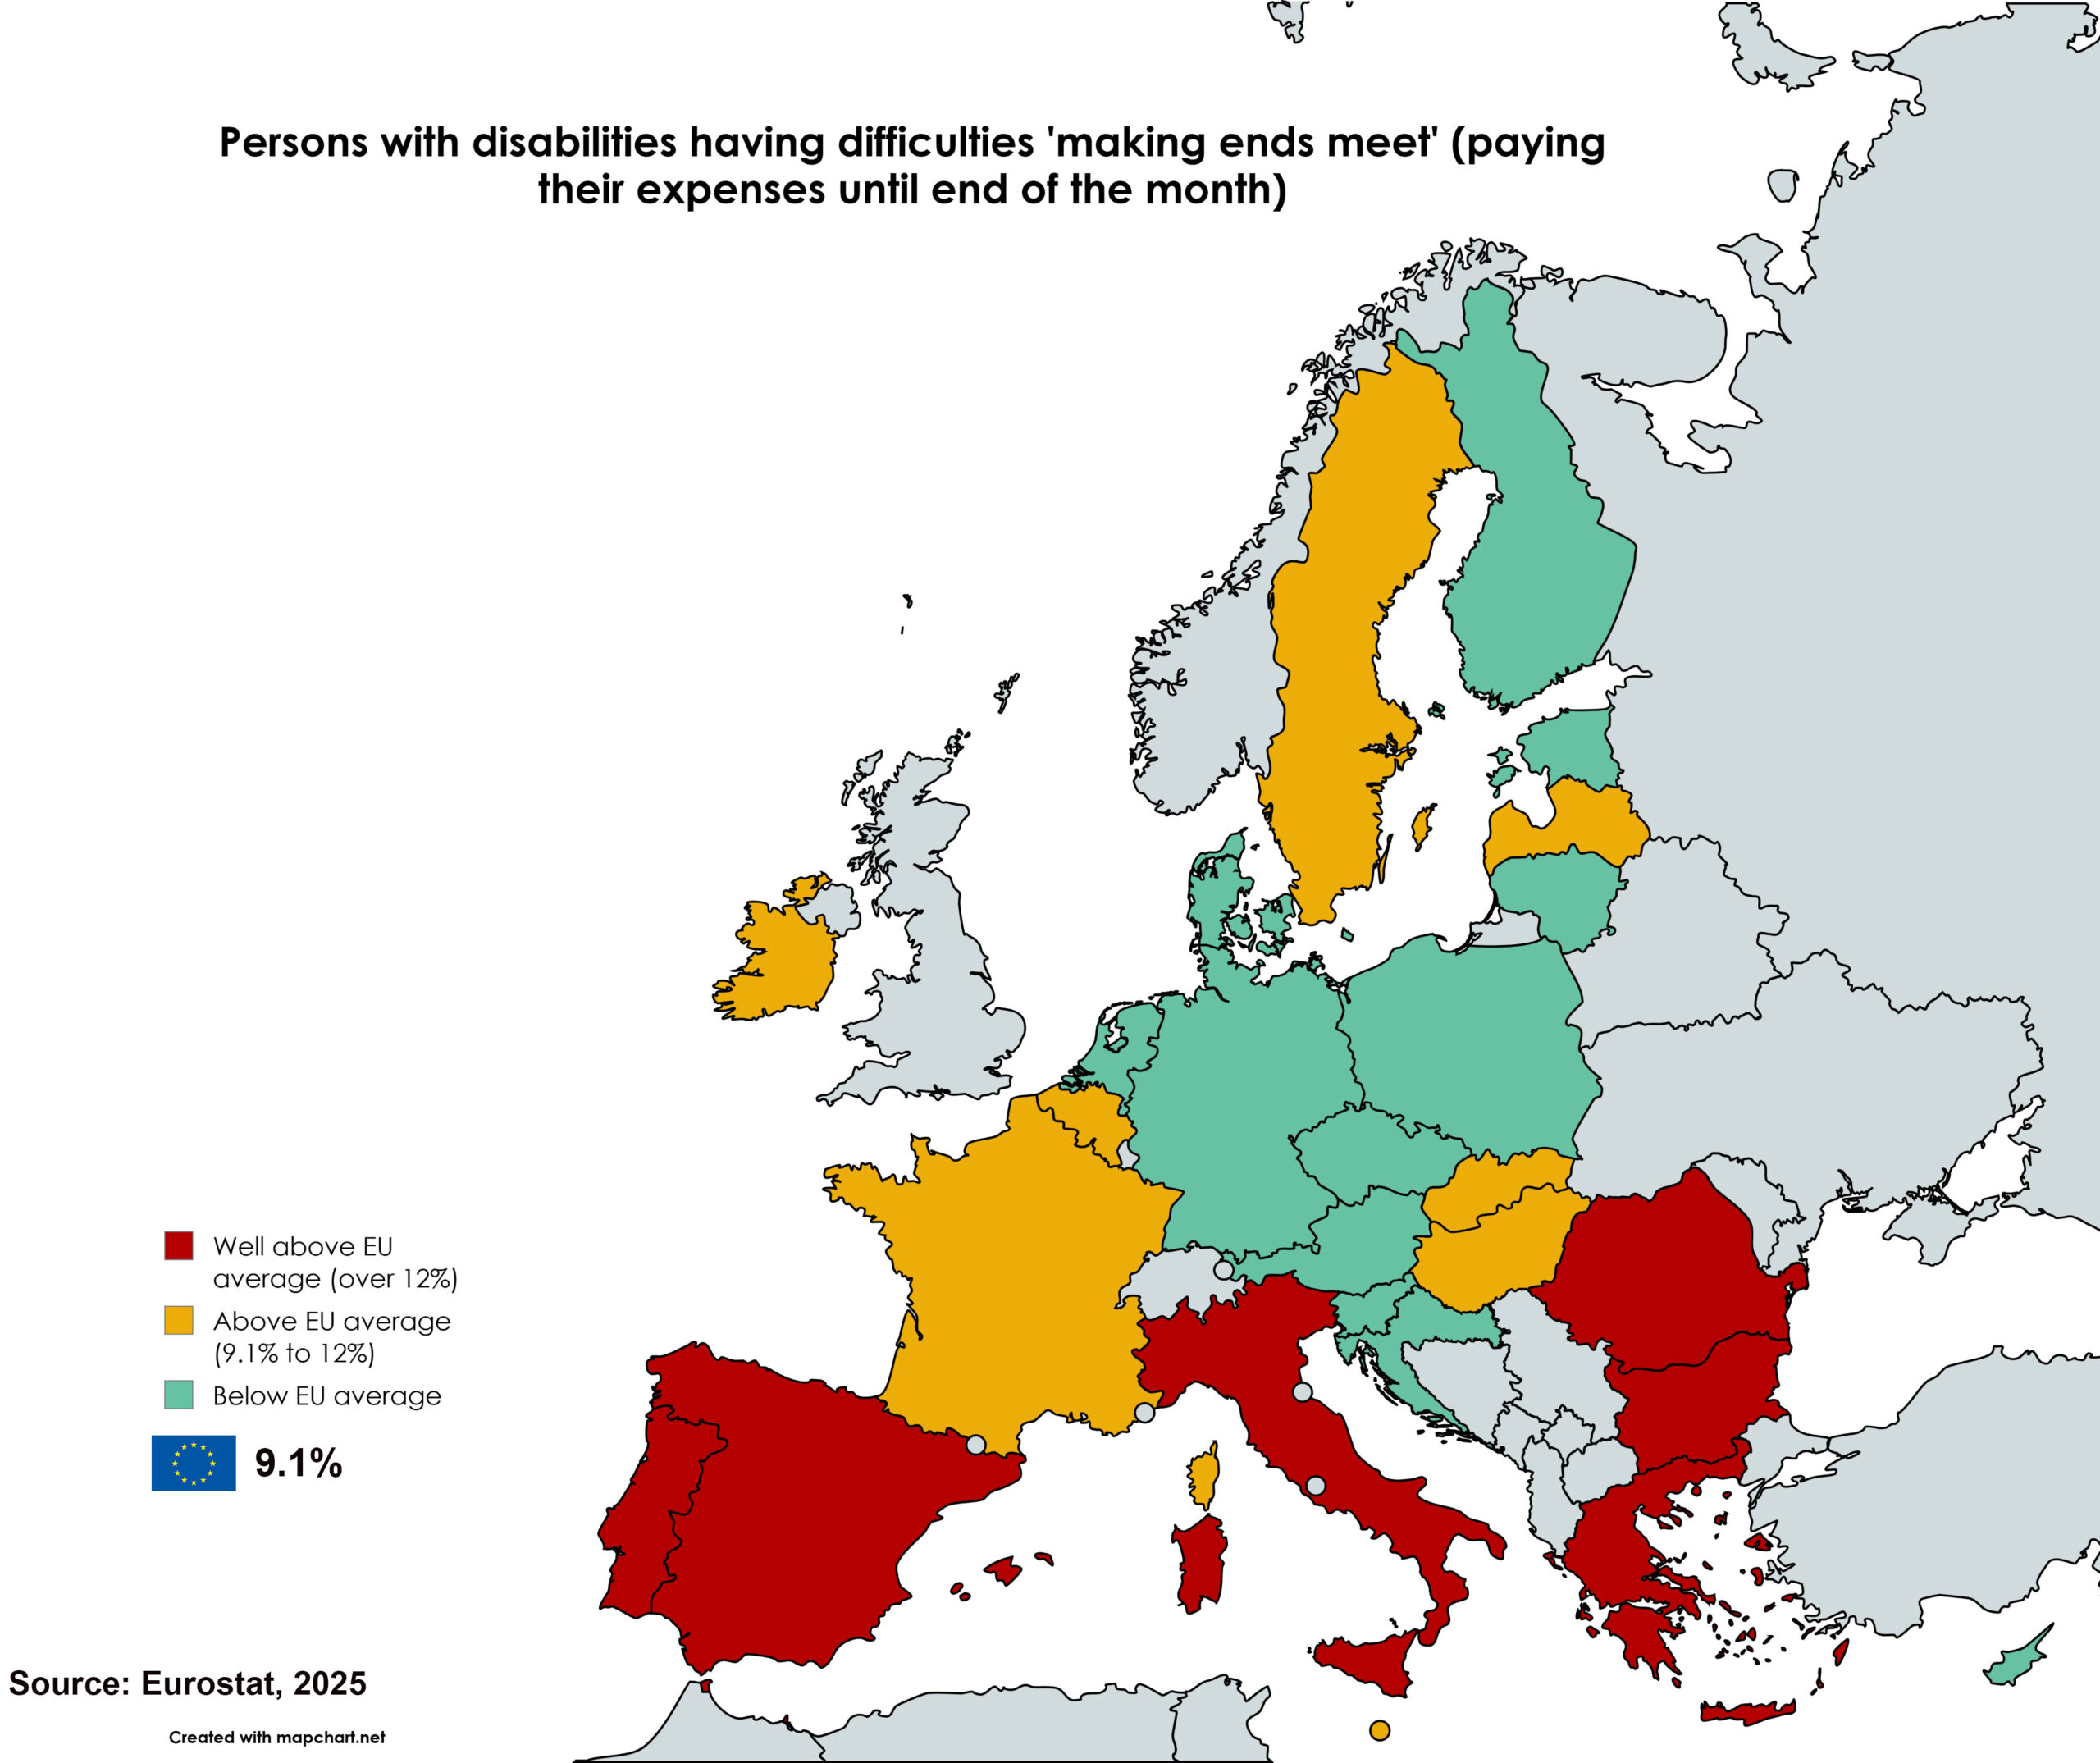
Review the statistics on inability to make ends meet
Map comparing percentage of persons with disabilities that have difficulties making ends meet
Unmet health needs
4.8% of persons with disabilities in the EU report having unmet health needs, compared to just 1.6% of people without disabilities.
The Member States that perform the worst are:
- Greece: 32.9% (6.9% for persons without disabilities)
- Finland: 14.7% (4% for persons without disabilities)
- Latvia: 14.1% (4% for persons without disabilities)
- Estonia: 12.9% (5% for persons without disabilities)
- Romania: 9% (1.3% for persons without disabilities)
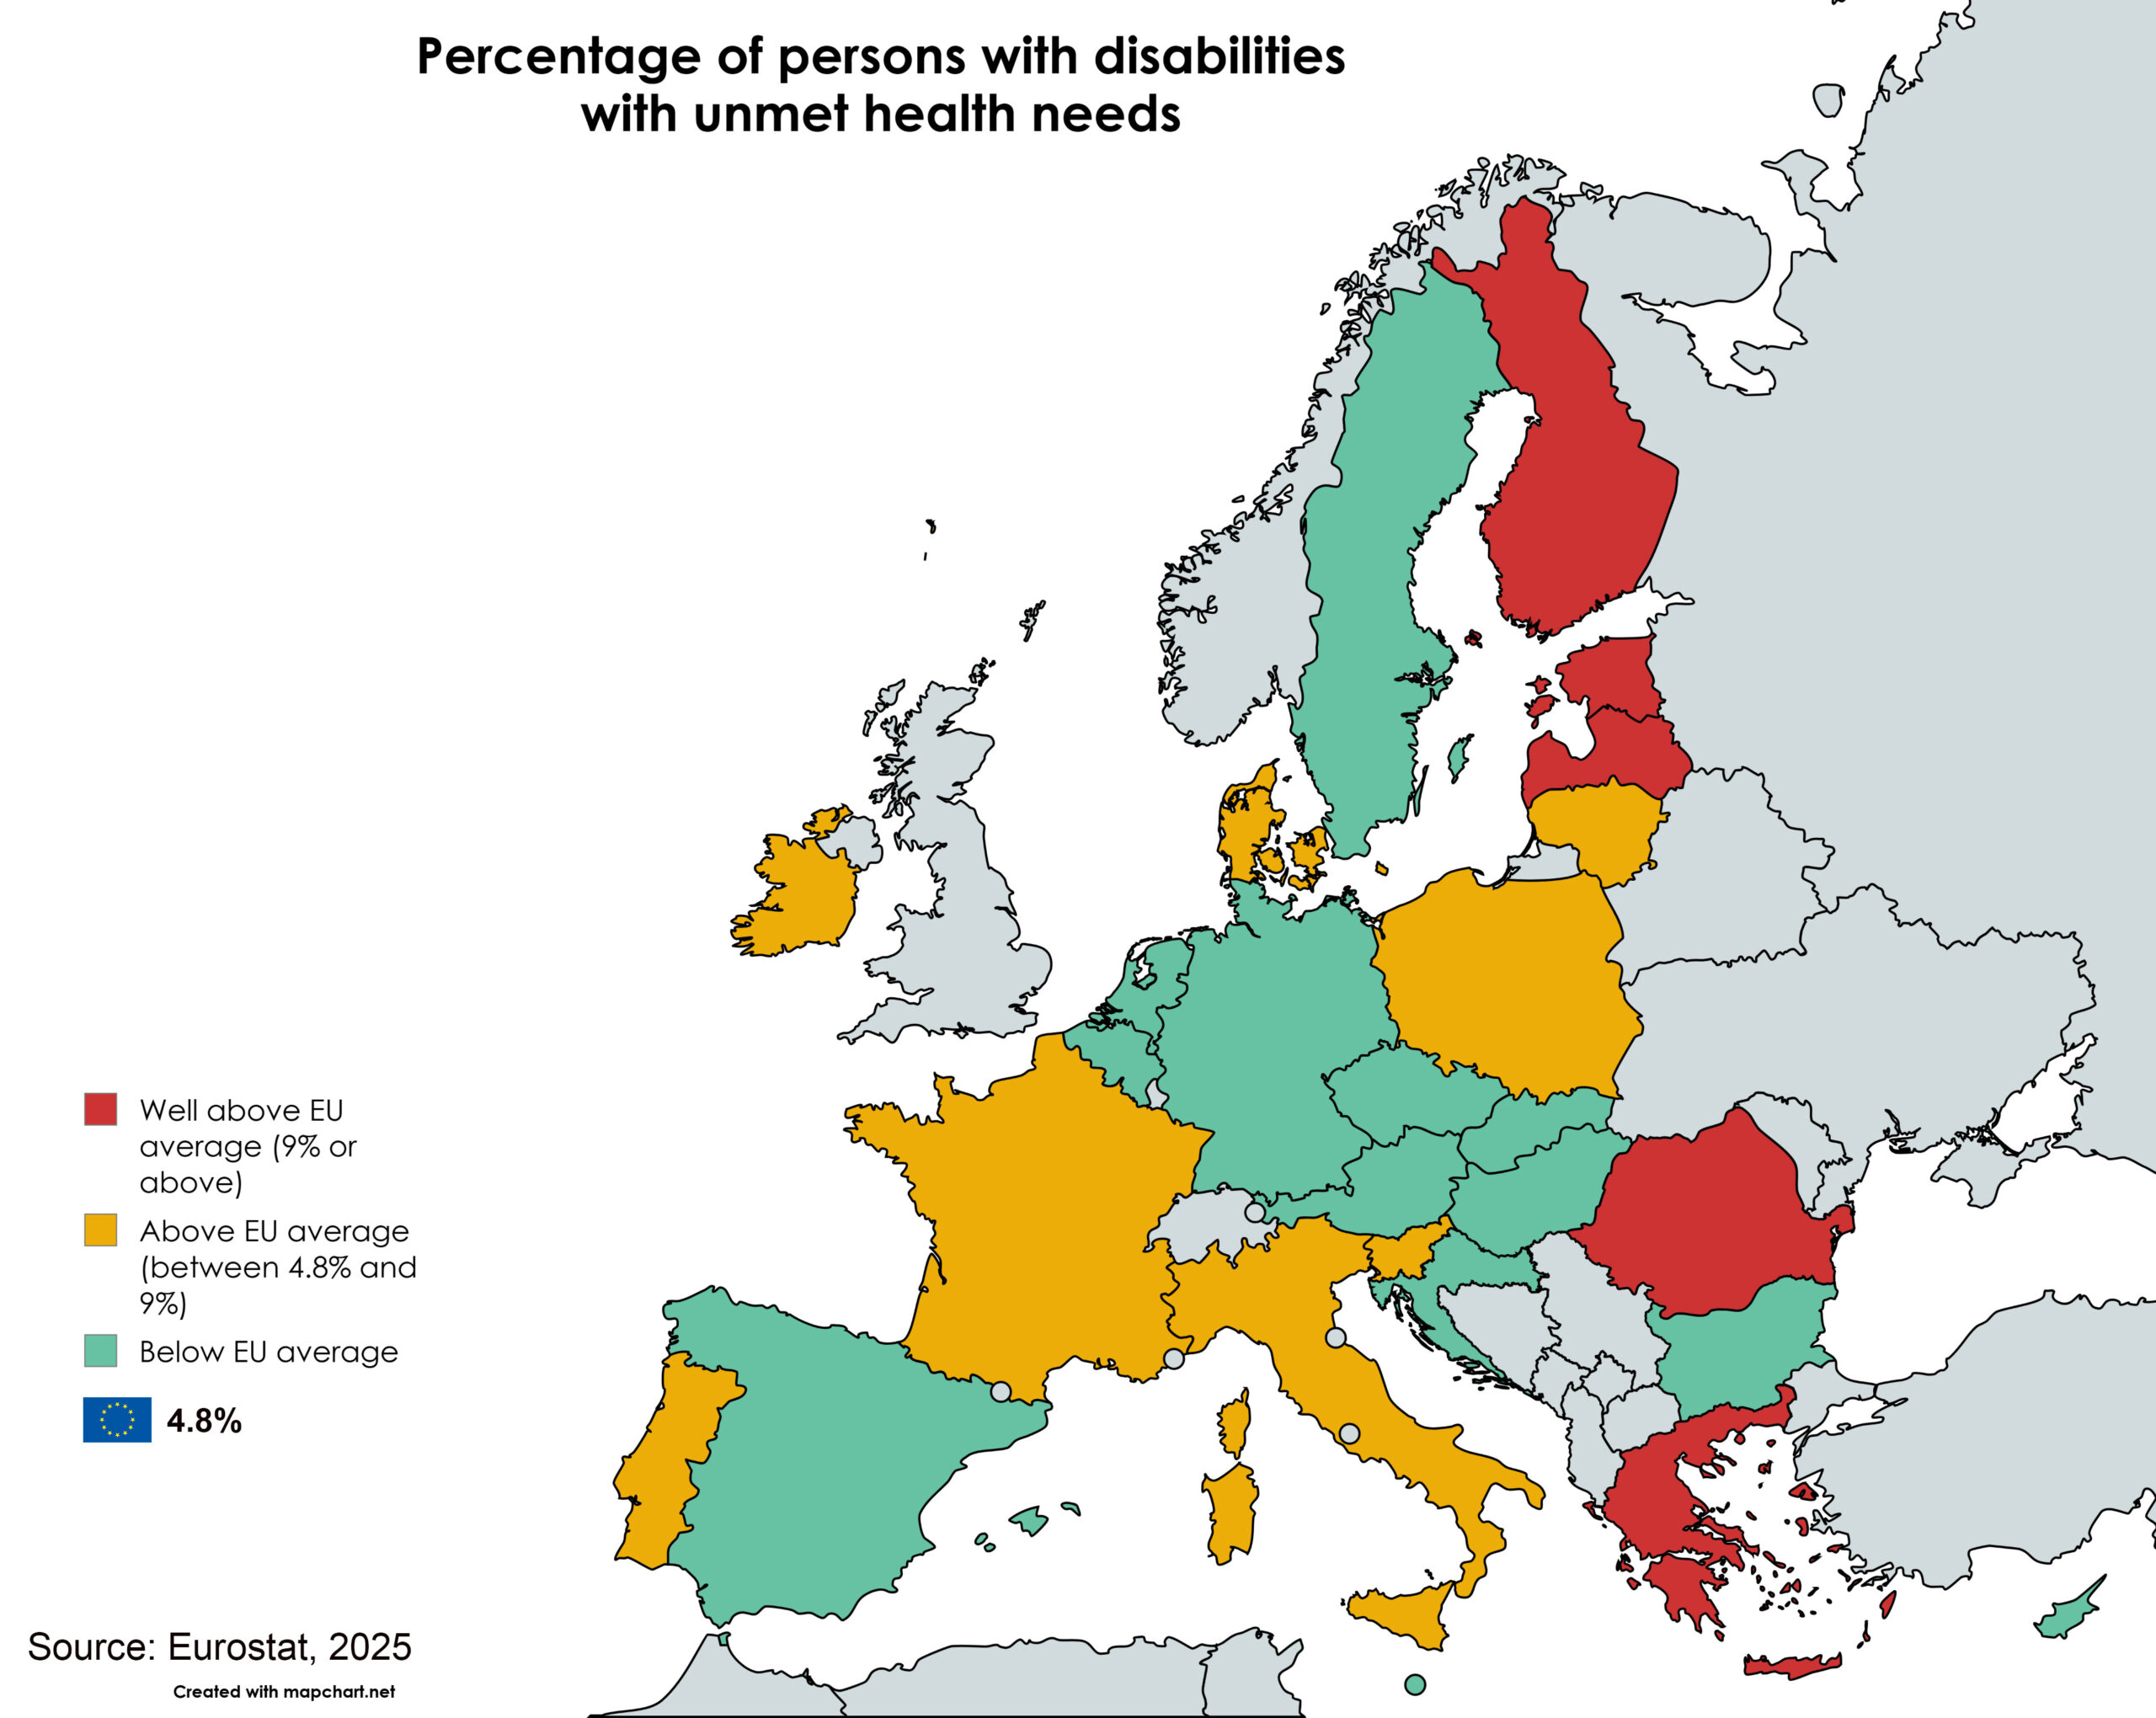
Review the statistics on unmet health needs.
Early school leavers
Young people with disabilities are much more likely to drop out of school early compared to their non-disabled peers. In the EU in 2024, 24.8% of all young people with a disability drop out of school early, compared to 8% of those without disabilities. We analysed people between 18 and 24 years of age who reported that they left school before compulsory education was completed.
The Member States where most young people with disabilities drop out of school early are:
- Romania: 61.6% (16.1% for learners without disabilities)
- Greece: 58.8% (1.2% for learners without disabilities)
- Bulgaria: 54.3% (8% for learners without disabilities)
- Lithuania: 42.5% (6% for learners without disabilities)
- Hungary: 41.2% (9.5% for learners without disabilities)
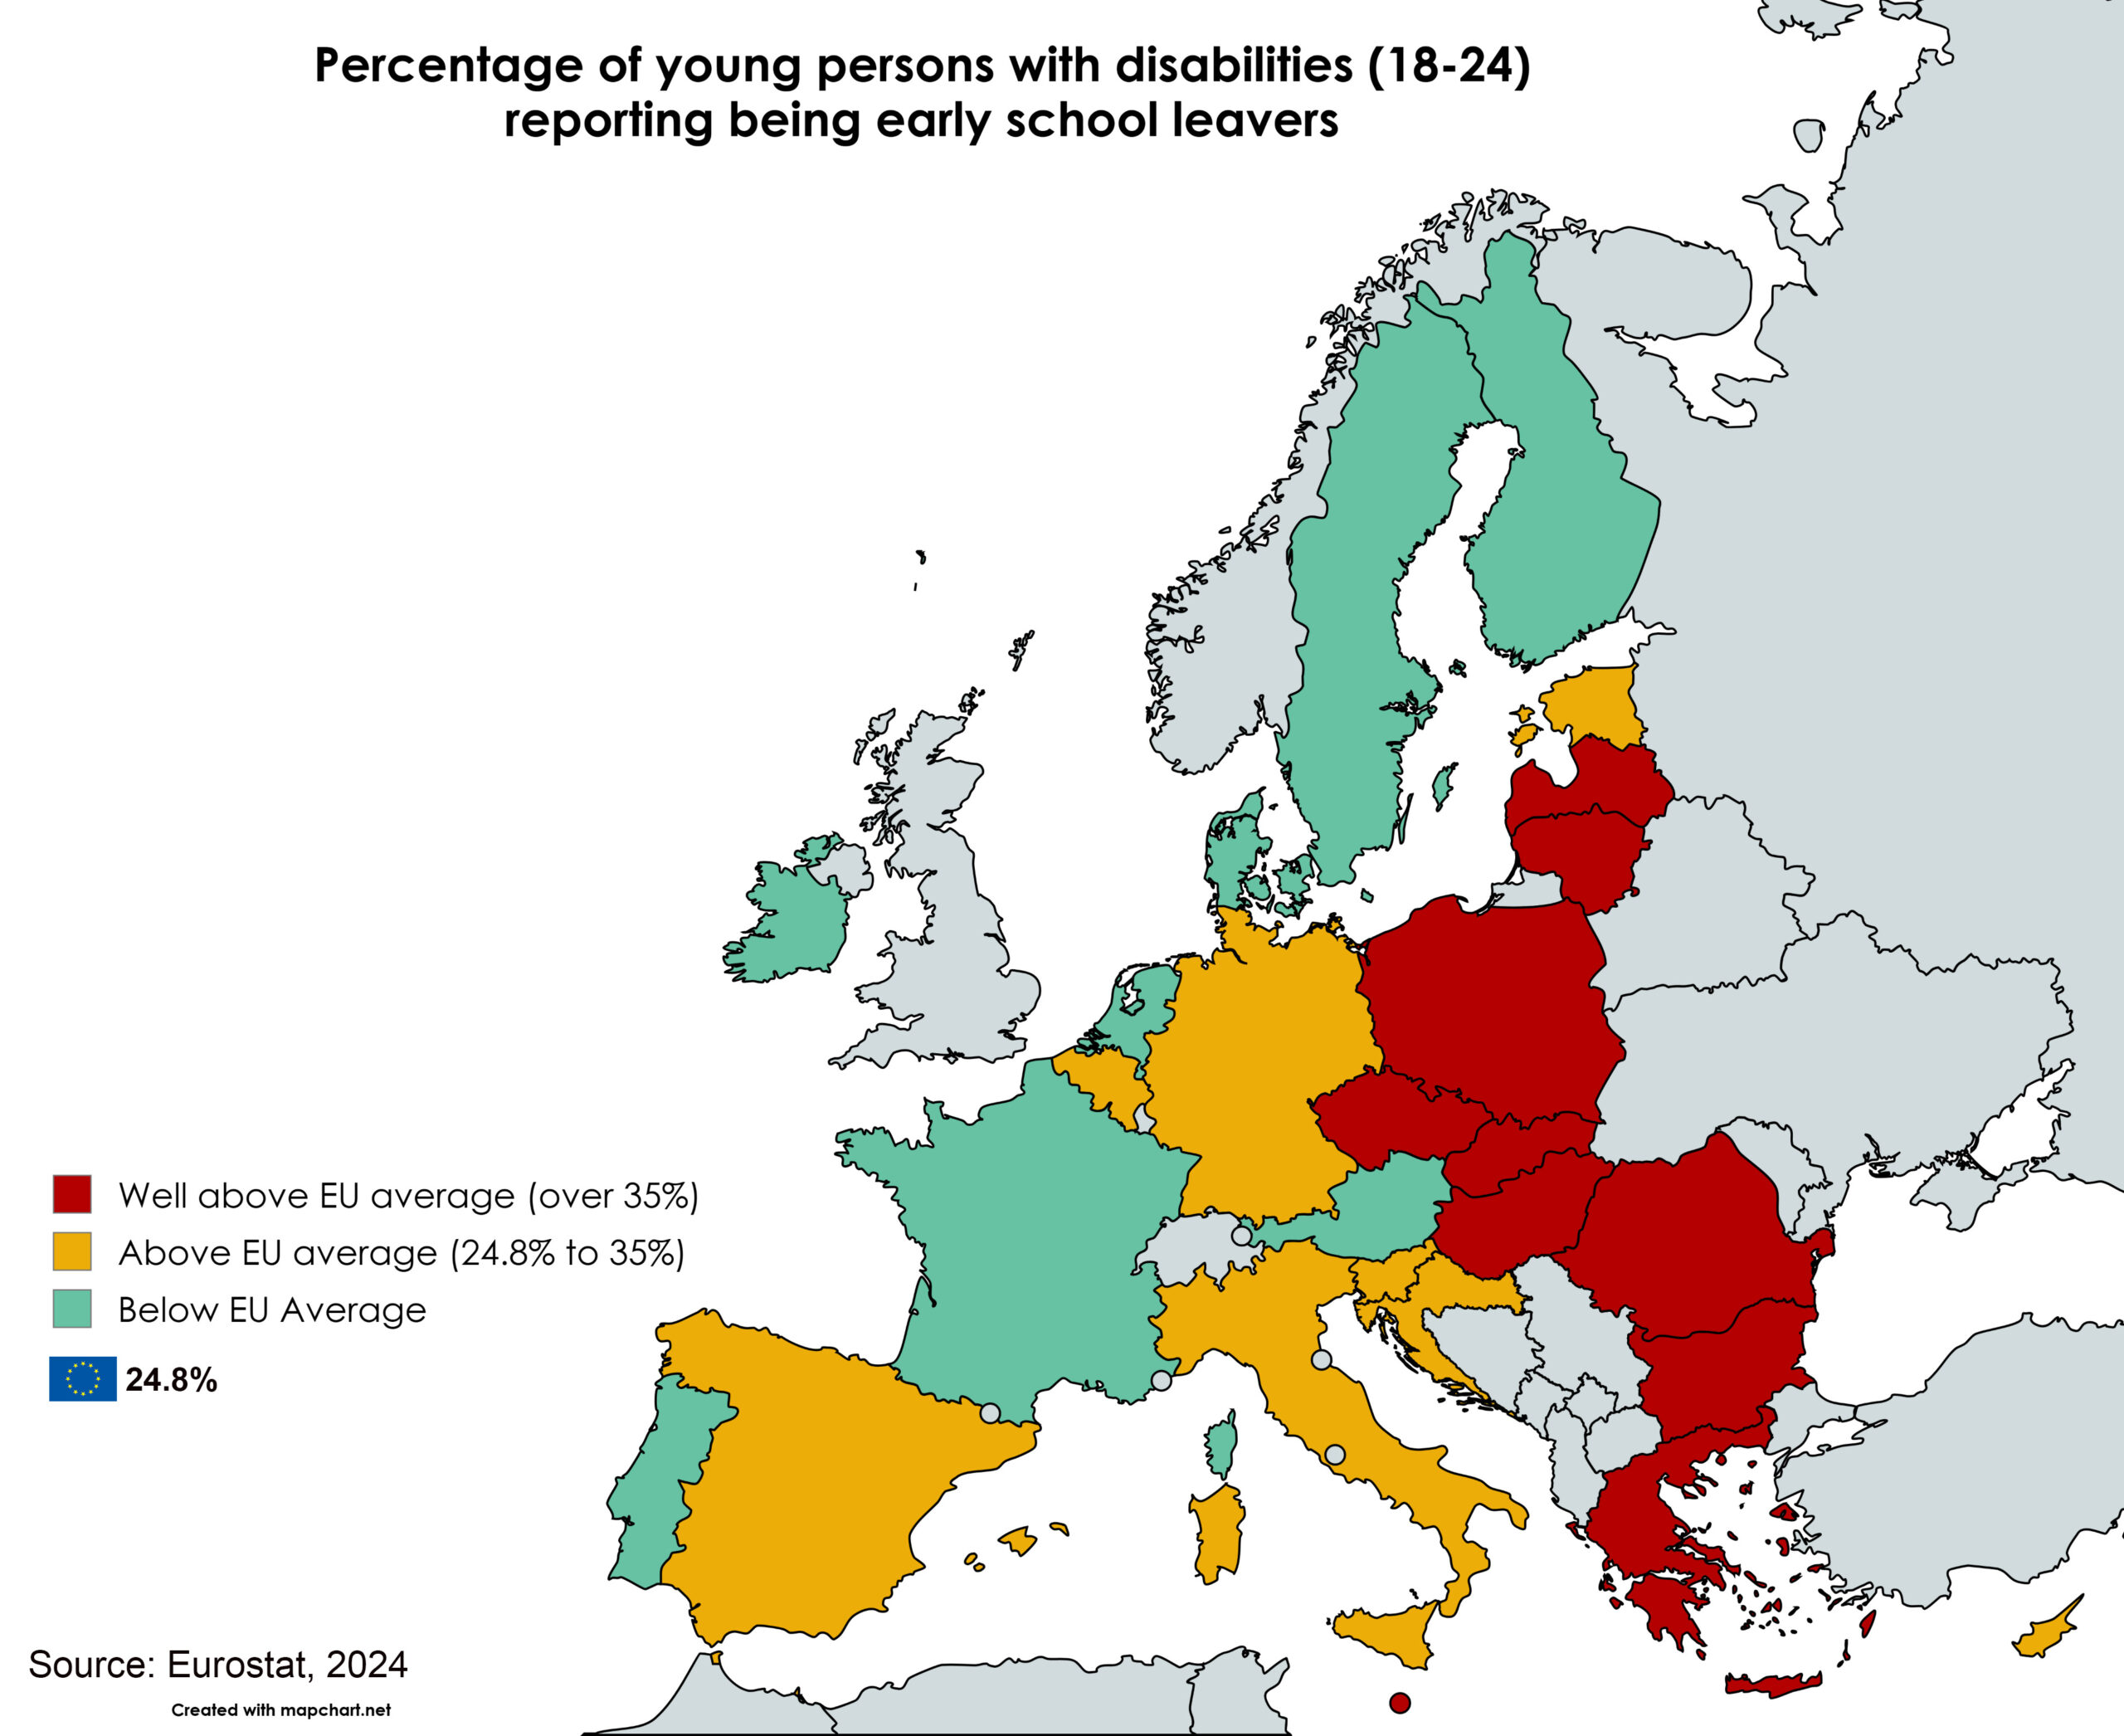
Discover the percentage of early school leavers with disabilities in all the EU countries